
with the peaq IOportal
-

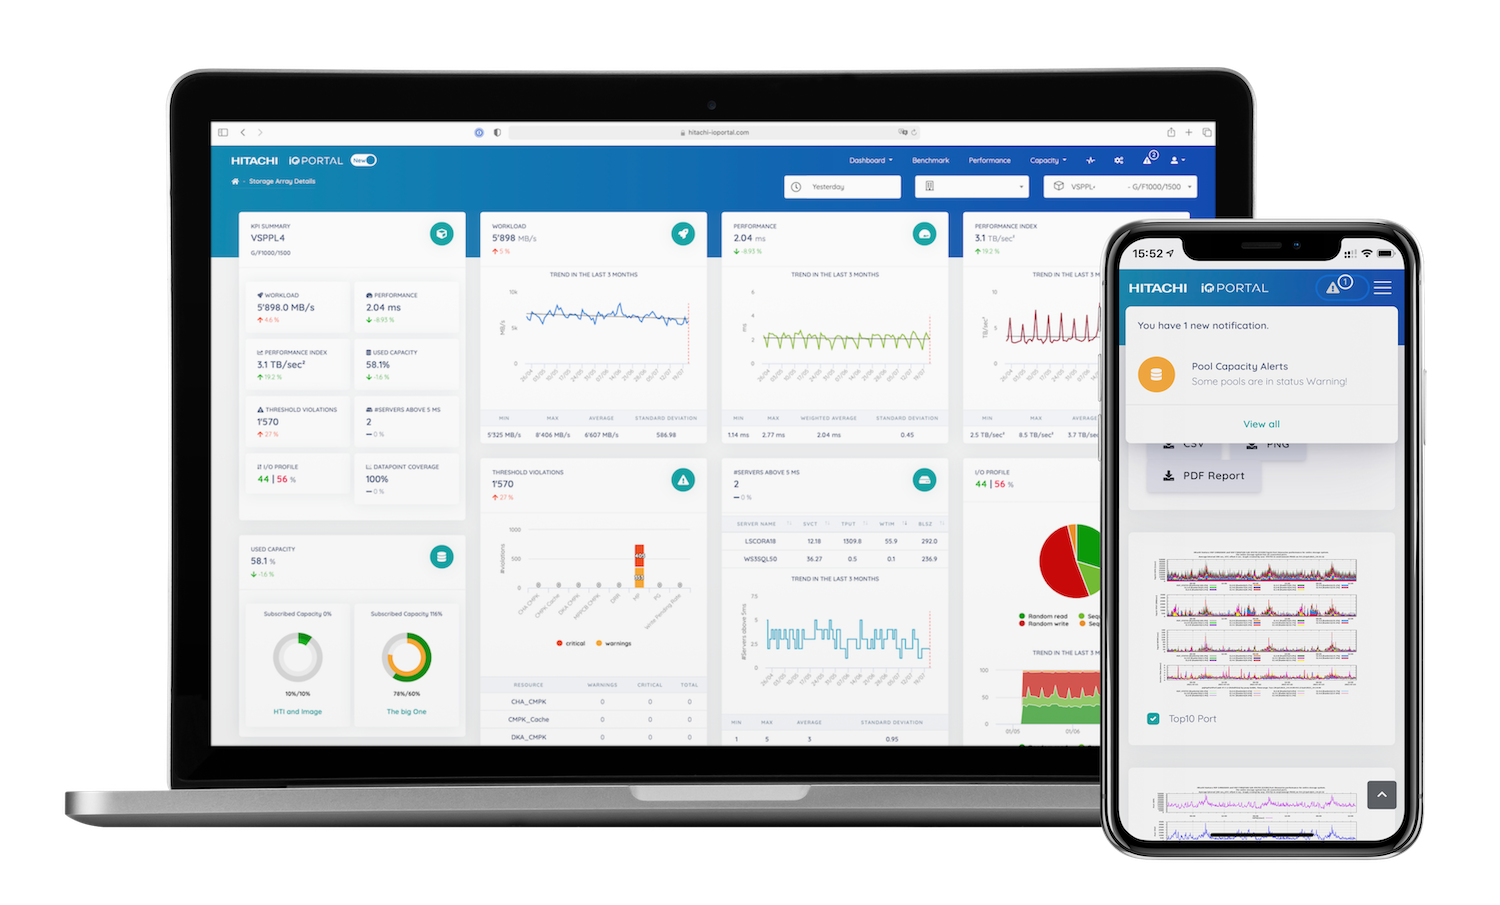
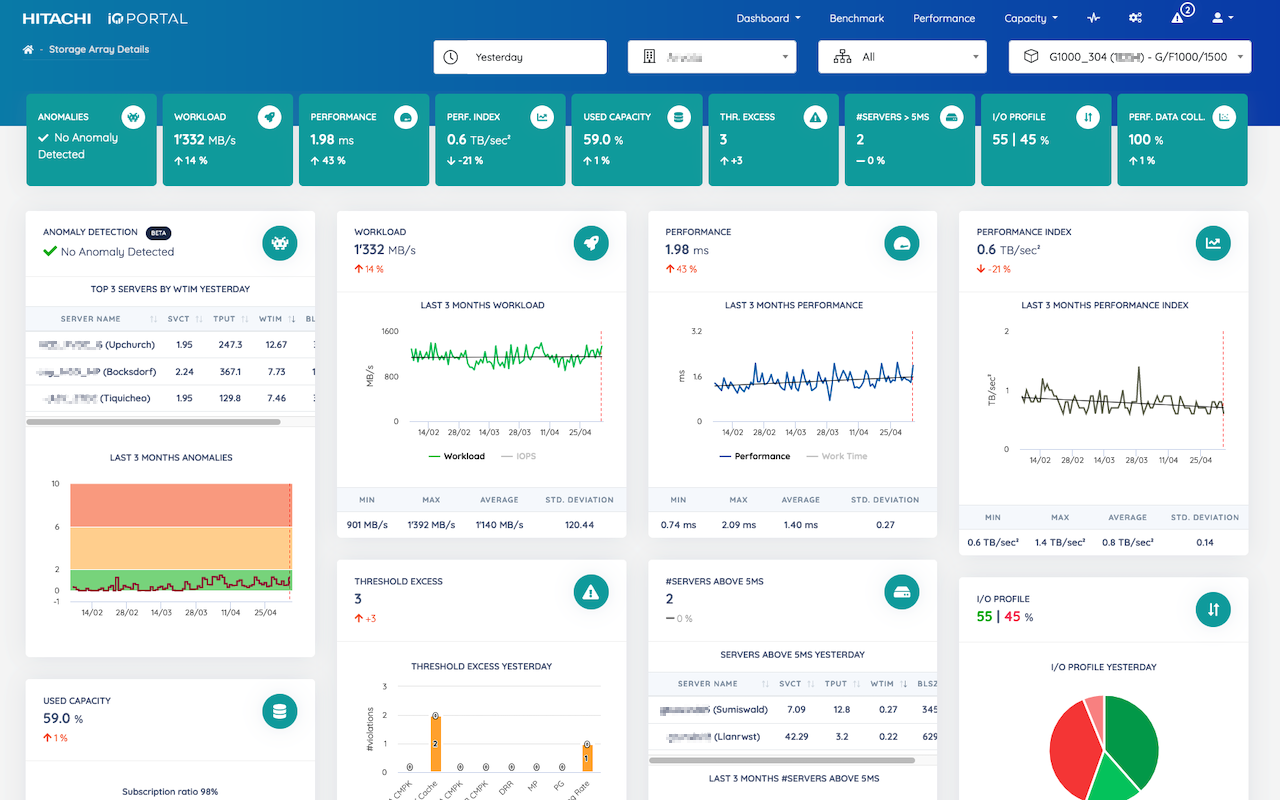
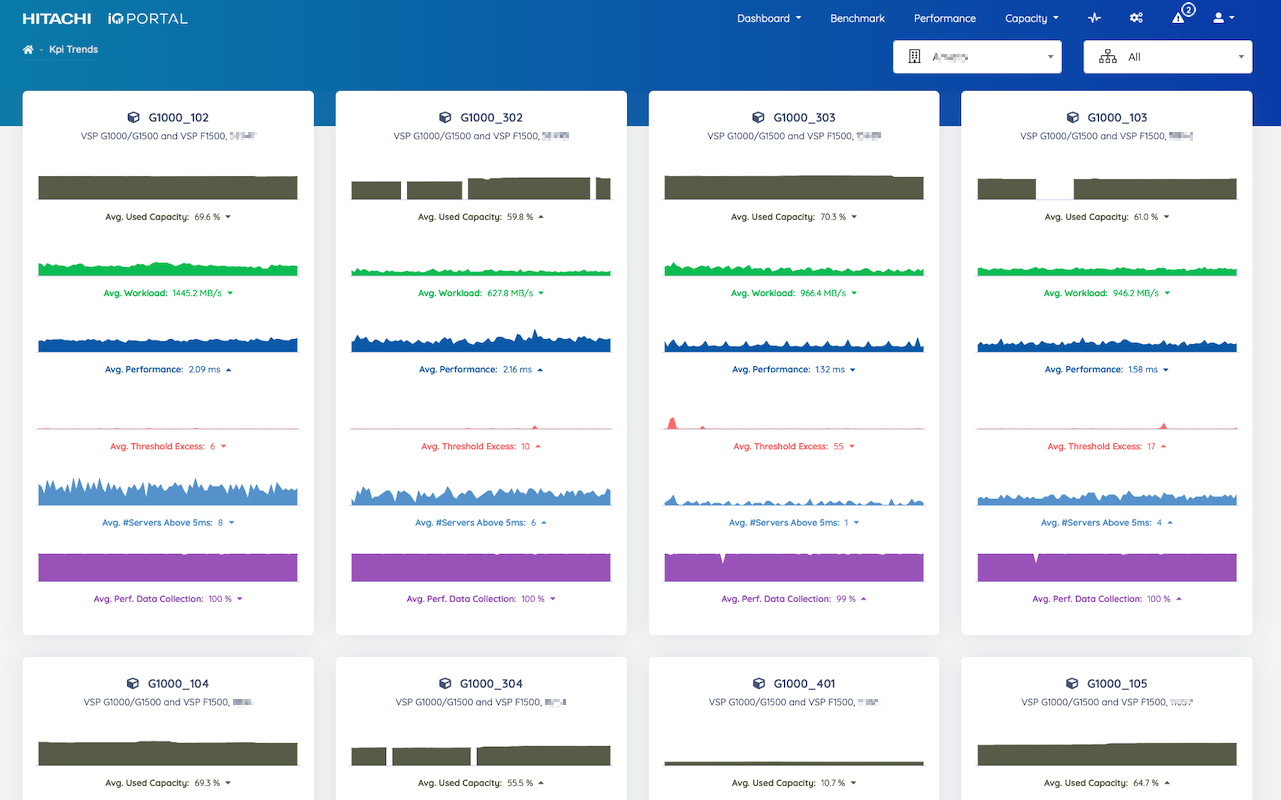
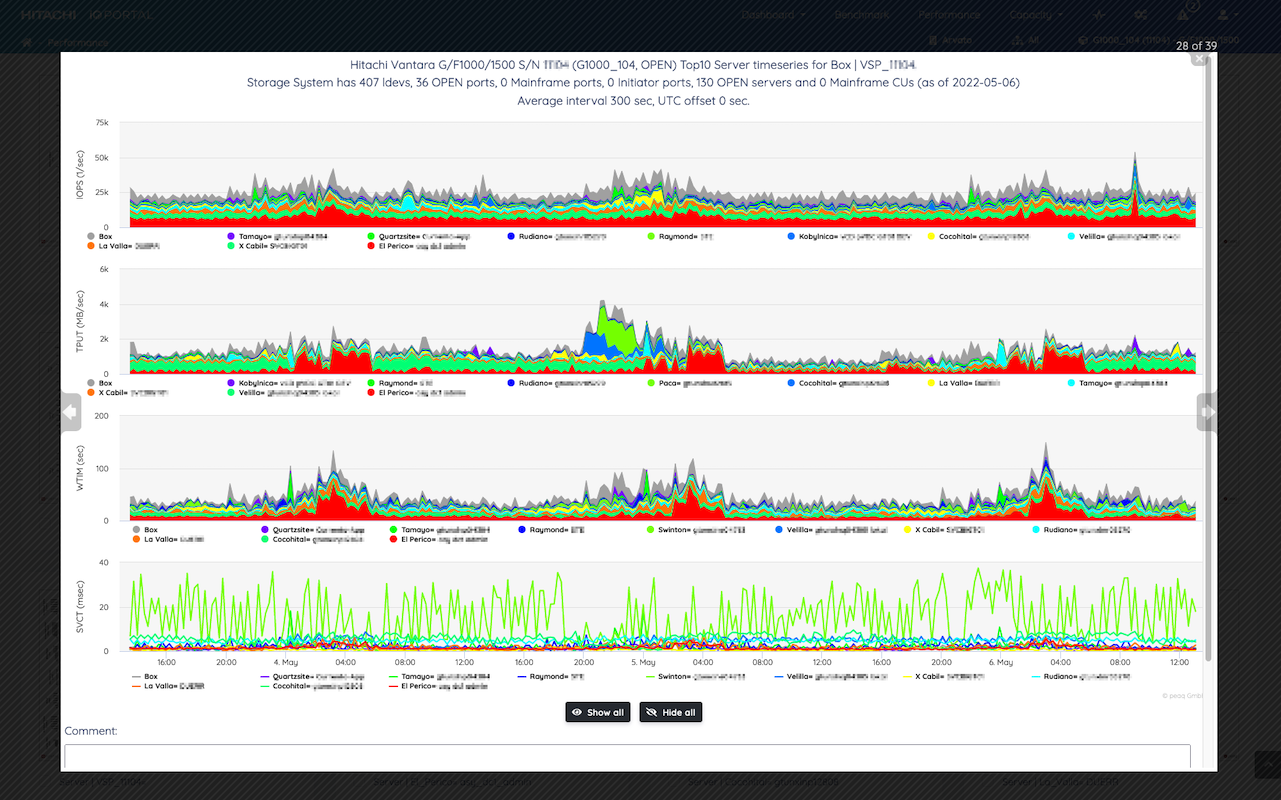
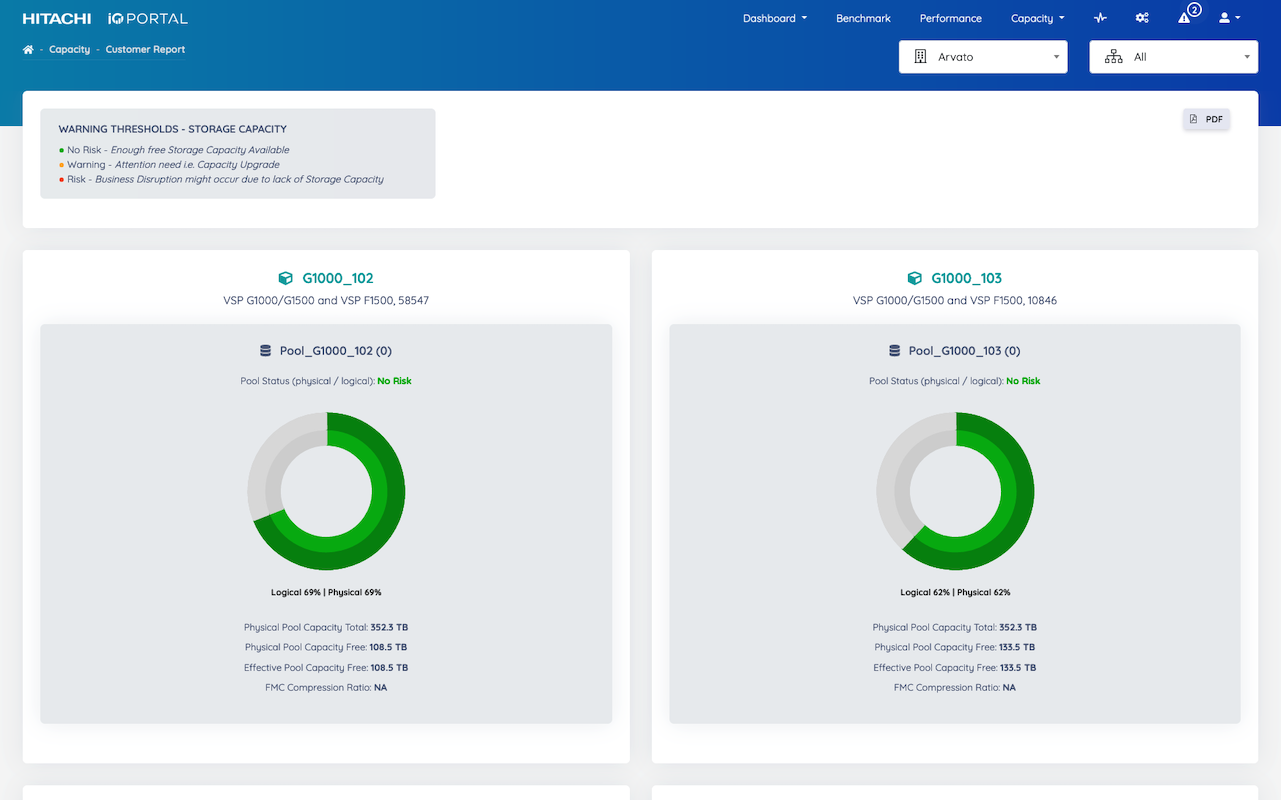
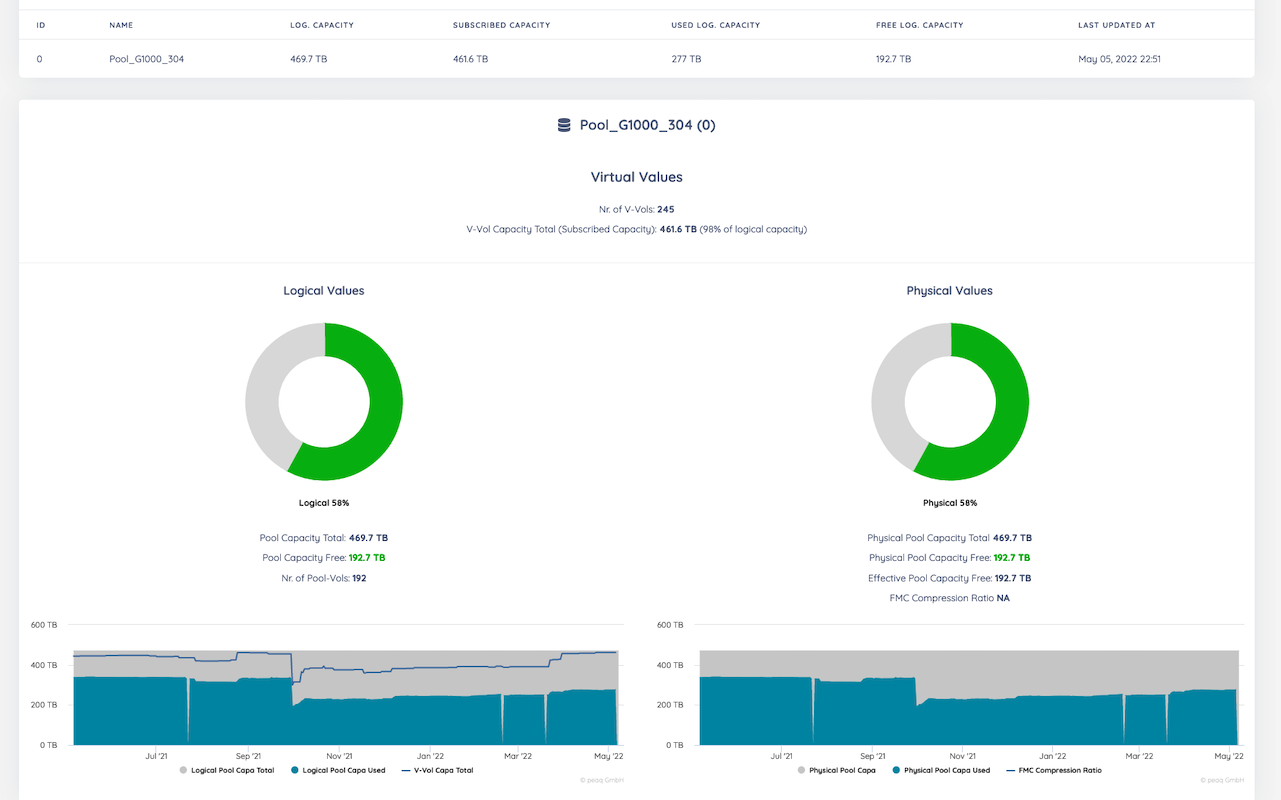
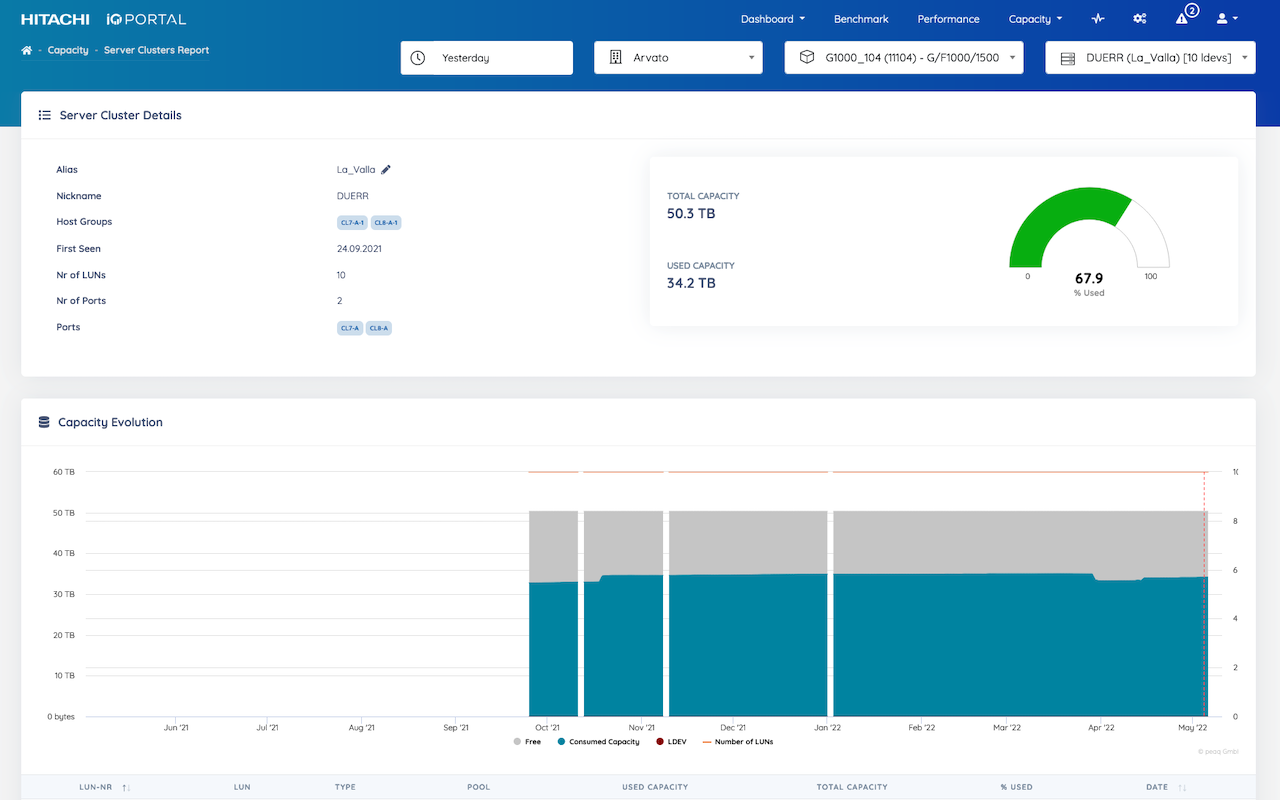
Capacity & Performance Monitoring
You can only improve your storage system services if you measure and understand their capacity and performance
-

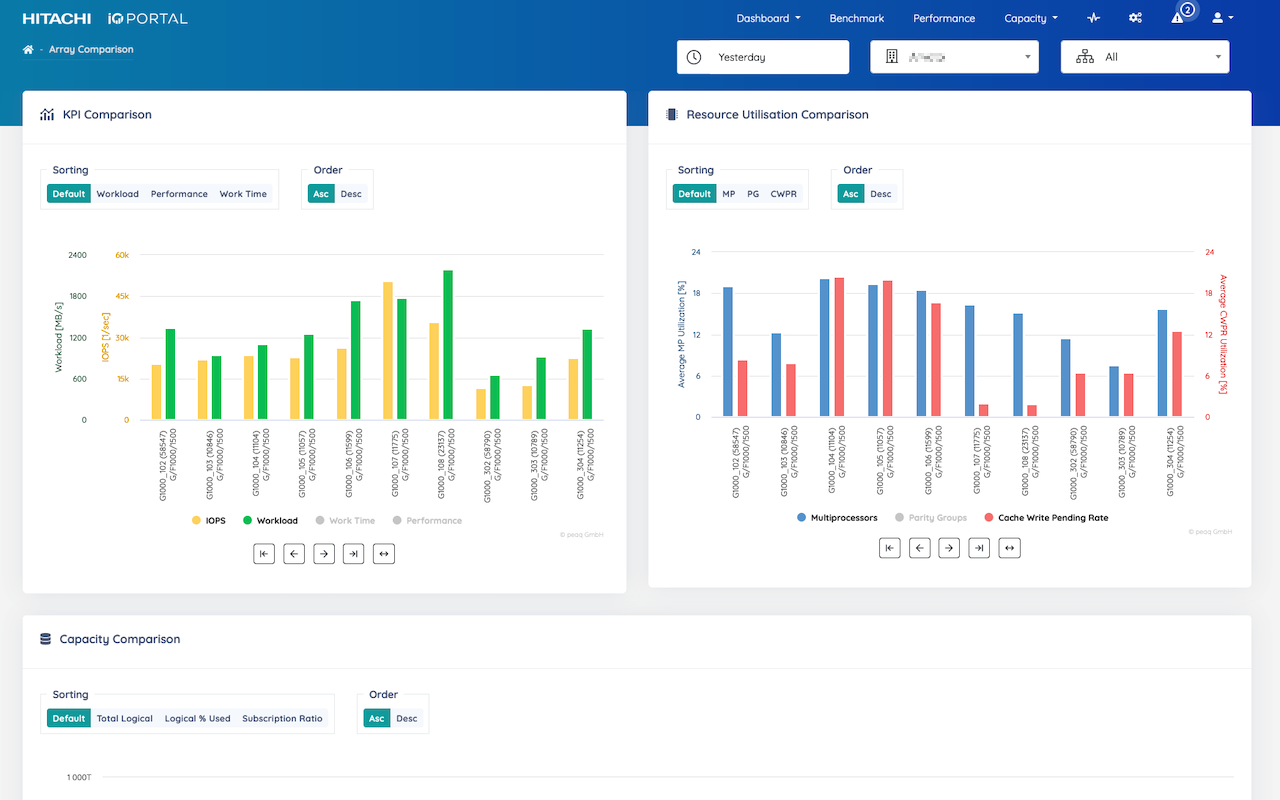
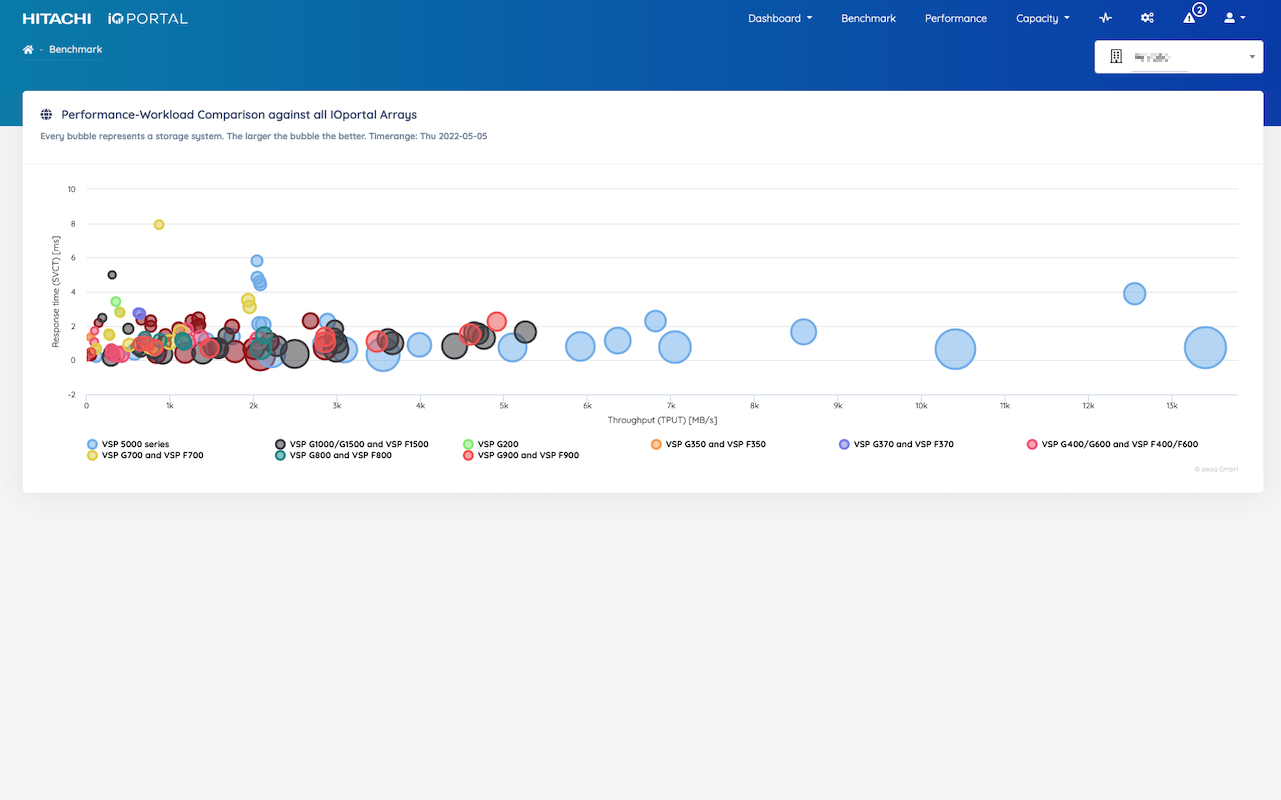
Visual Root Cause Analysis
IOportal unique analytical methods allow for fast, reliable and visual root cause identification
-

Health Checks
Identify and mitigate slow creeping performance degradations with the IOportal Health Checks
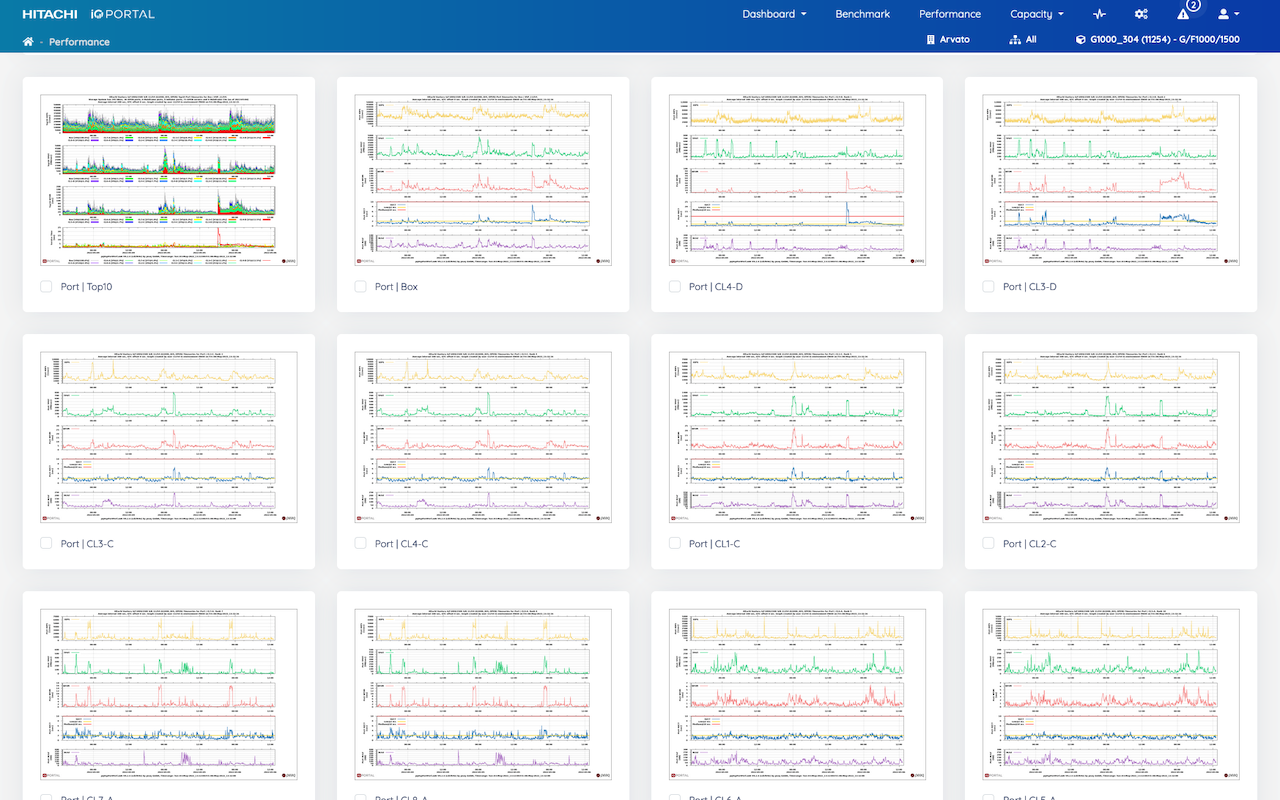
With its intuitive navigation, comprehensive graphs and reports the cloud based IOportal is the ideal capacity and performance management tool for any small to large and very large sized customers. Thanks to its easy, fast implementation customers get immediate return on investment.
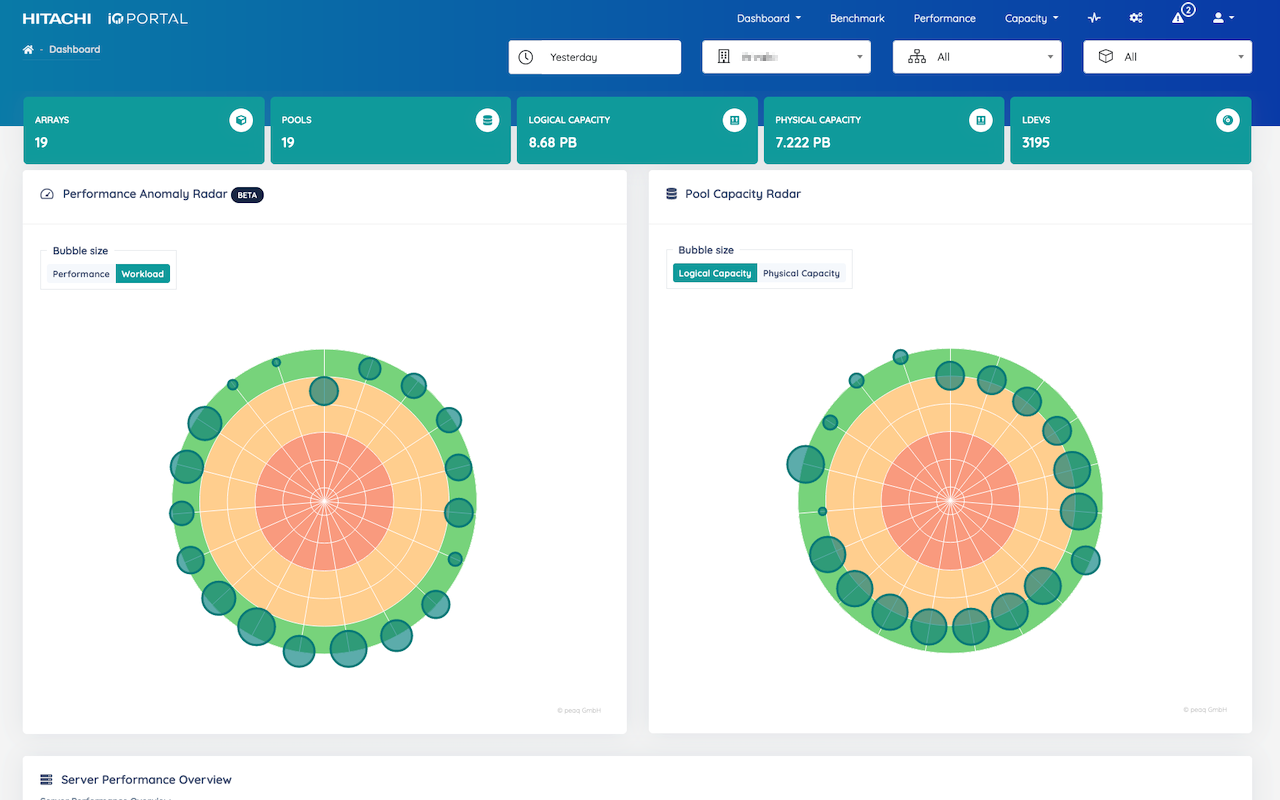
Integrated visual root cause identification, inherent data aggregation specifically for storage system analysis, dedicated server graphs independant of their underlying operating system, and a smart, artificial intelligence based anomaly detection system in combination with the new dashboard that guides you from the automatic detection of an anomaly allow reduced size storage management teams to manage a large and very large number of storage systems with ease.
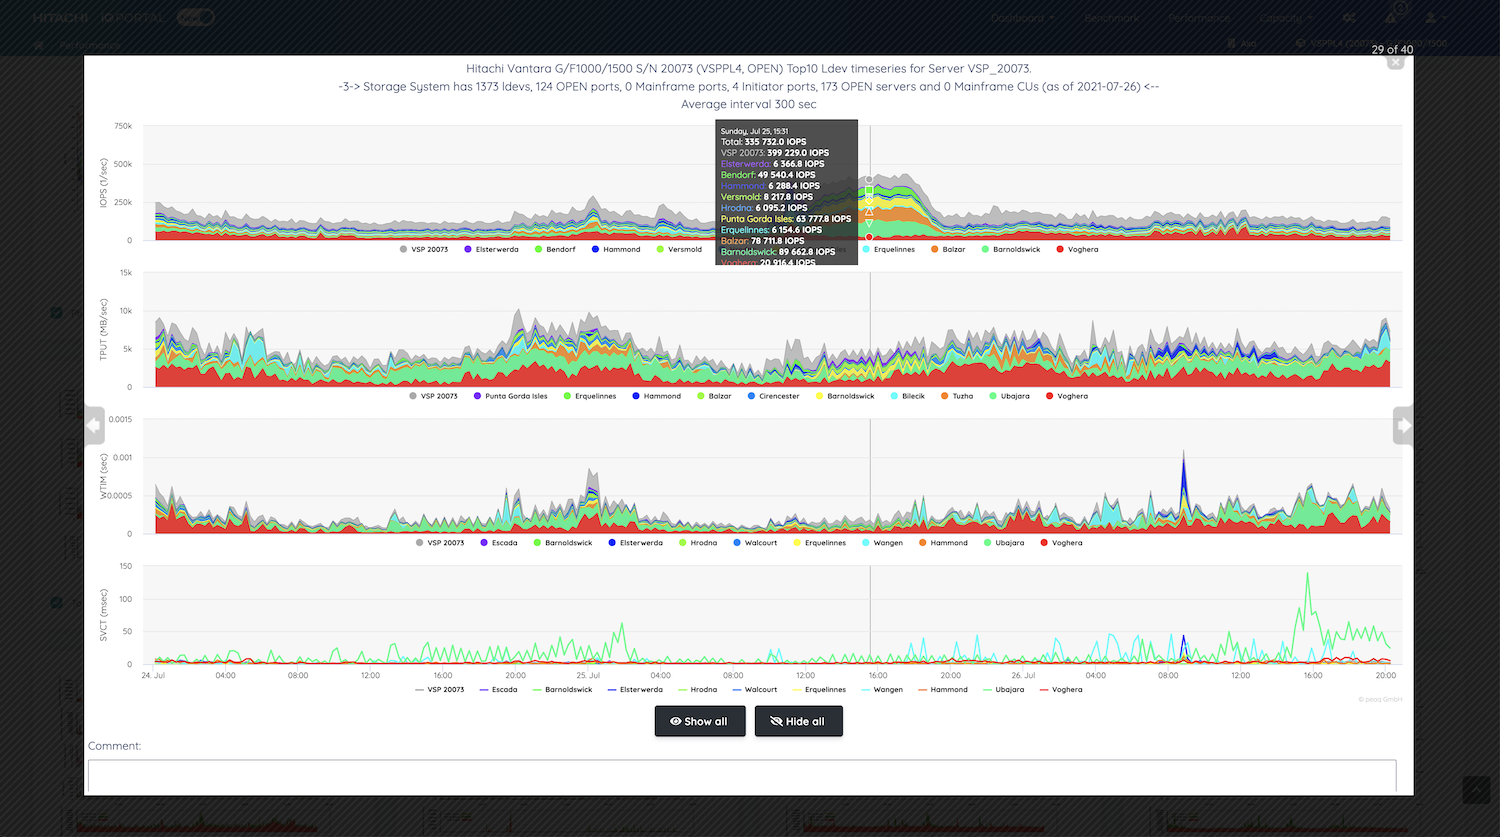
Looking for root causes of an incident is usually a time-consuming and painful excercise, especially outside normal working hours and/or during weekends. A tool that automatically and reliably detects the cause of a performance degradation will make storage administrators, managers and customers life easier. The IOportal does exactly that.

The IOportal complementary Health Check Service helps identify slow creeping performance degradations and capacity constraints that are otherwise difficult to detect on a day-to-day basis. With a fixed document structure the customer gets a standard Health Check report that is discussed face-to-face including findings, conclusions and corrective action with the goal to fix any issue before the storage consumers are faced with performance degradations. The Health Check reports cover long term evolution of system workload, resource utilisation, performance (that is response times) and threshold excess. For the critical resources, like ports, crossbar or the VSP5x00 interconnect, dedicated reports help identify hotspots and recommendations allow to balance resource utilisation in order to achieve maximum scalability of the storage system. Thus, the IOportal Health Check service ensures long time stability and optimum performance giving customers the peace of mind to focus on their day-to-day business tasks.
Install IOportal Agent.
Configure agent, firewall and Cloud Service.
Generate insights from day 1
Accessible from anywhere and any device
Integrated analytics functions
Manage very large number of storage systems from anywhere
Rapid deployment and fast learning curve
Monitor Open and Mainframe systems
Increase infrastructure efficiency and reduce operational risk
Supports Hitachi block storage
Proactive Health Checks are available as an add-on service
REST API for integration with 3rd party systems
"One of our central storage systems with 500 connected servers was hit by severe performance degradations threatening all connected servers and business critical applications. After several months of failed attempts at identifying the root cause and mitigating the impact by a countless series of unsuccessful hardware, firmware and software component upgrades, leaving a long trail of blood, sweat and tears behind, the data was eventually uploaded to the IOportal cloud service and the root cause could be identified within 30 mins, the involved server/database was shut down and the nightmare stopped immediately."
"Thanks to the IOportal we could work out a storage landscape refresh of our 300+ storage systems within a weekend. With the level of aggregation and the concise and meaningful graphs the IOportal offers it was minimum effort to work out the requirements in terms of capacity and performance and plan new storage infrastructure accordingly."